
Are you ready to move beyond market chatter and truly understand what makes a company a great investment?
In the exciting world of finance, the key to smart, successful investing isn’t just knowing what stock to buy, but knowing why that company is healthy and profitable. This is where Profitability Ratios come in.
Think of these ratios as the essential tools on your investor dashboard. They turn complex financial statements into clear, digestible insights, telling you how efficiently a business converts its efforts and resources into actual profit. Mastering them is the first step toward building a robust and successful portfolio in Ghana and beyond!
What Are Profitability Ratios and Why Do They Matter to You?
Profitability ratios are simple calculations that measure a company’s ability to generate income relative to its revenue, operating costs, and the capital invested in it.
As an investor, you need these ratios because they answer the fundamental question: “Is this company making money, and how effectively is it doing so?”
If a business can’t make money efficiently, its long-term viability and consequently your investment’s potential return is questionable.
📈 The Essential Profitability Ratios for Beginners
Let’s break down the most crucial metrics you’ll find when analyzing a company listed on the Ghana Stock Exchange (GSE) or anywhere else.
1. Margin Ratios: Assessing Profitability from Sales
Margin ratios show what percentage of every GHS 1.00 in sales actually turns into profit at different stages.
A. Gross Profit Margin (GPM)
What it Measures: This is the first stop! It shows the percentage of revenue left after subtracting the Cost of Goods Sold (COGS). This tells you how profitable the company’s core product or service is before you factor in anything else.
The Formula:

Interpretation: A higher GPM is fantastic! It indicates that the company has good control over its production costs or the power to price its products well. If Company A has a GPM of 40% and Company B has 20%, Company A is far more effective at turning sales into initial profit.
B. Operating Profit Margin (OPM)
What it Measures: This ratio reveals the percentage of revenue remaining after covering cost of goods sold and all operating expenses (like rent, salaries, utilities, and marketing). It assesses the efficiency of the company’s day-to-day core business operations.
The Formula:

Interpretation: This is a key metric for judging management quality. A high OPM suggests management is running the business tightly and efficiently. If this margin is much lower than the GPM, it’s a warning sign that the company is spending too much on its general overhead.
C. Net Profit Margin (NPM)
What it Measures: The final, most important margin! This is the percentage of revenue remaining after all expenses—COGS, operating costs, interest payments, and taxes—have been deducted. This is the actual profit that can be reinvested or paid out to shareholders.
The Formula:
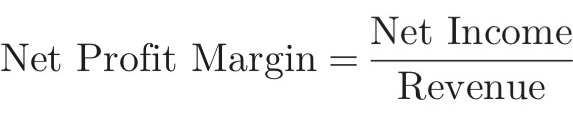
Interpretation: This is the bottom line efficiency. If a company’s NPM is 10%, it means for every GHS 1.00 in sales, GHS 0.10 goes to the owners (you, the investor!). You generally want to see this margin remain stable or increase over time.
2. Return Ratios: Assessing Profitability from Investment
Return ratios measure how well the company uses the money it has—whether from its owners or debt—to generate profit.
A. Return on Assets (ROA)
What it Measures: This ratio tells you how efficiently the company is using all of its assets (cash, inventory, property, etc.) to generate net income. It measures overall asset productivity.
The Formula:

Interpretation: If a company has an ROA of 15%, it means for every GHS 100 in assets it controls, it generates GHS 15 in net income. Higher ROA suggests superior asset management. When comparing two companies in the same industry, choose the one with the better ROA—it’s getting more profit out of its resources.
B. Return on Equity (ROE)
What it Measures: This is arguably the most critical ratio for shareholders! It measures the profit generated relative to the money invested by the shareholders (equity). It shows you the return you are personally getting on the funds you and other owners put in.
The Formula:

Interpretation: A high ROE demonstrates that the management team is excellent at reinvesting shareholder capital and turning it into greater profits. It’s a key indicator of compounding power and wealth creation. A consistently high ROE (say, over 15-20%) is often characteristic of market leaders.
How These Ratios Benefit the Beginner Investor
Here is your simple guide to applying ratios:
1. Spotting High-Quality Businesses:
- Look for companies with stable or rising margins (NPM, OPM). This shows consistency and pricing power, which are great traits for long-term investments.
- High ROE is a reliable signal of a company that generates substantial income from its owners’ funds, often leading to excellent stock performance.
2. Comparison is Key (Benchmarking):
- Never look at a single ratio in isolation! Compare a company’s ratios to its main competitors in the same sector. If a bank has an ROA of 3% while its rival has 1%, you know which one is managing its assets better.
- Compare the current ratios to the company’s past performance (3-5 years). Is the company getting more profitable, or is it slowly bleeding efficiency?
3. Risk Mitigation and Due Diligence:
- Companies with weak or declining profitability ratios are often higher risk. They may struggle to weather economic downturns, pay their debts, or fund future growth.
- By checking the margins, you perform crucial due diligence and avoid potential pitfalls.
Your Investor Takeaway:
Profitability ratios are your personal analytical toolkit. They empower you to look past headlines and hype, and focus on the cold, hard financial facts. By using these simple formulas, you can confidently identify financially strong businesses listed in the stock markets that are most likely to deliver exceptional returns.
Start your journey today: Pick a Ghanaian company you admire, look up its financial statements (annual reports), and calculate its Net Profit Margin and Return on Equity. You’ll instantly become a smarter, more empowered investor!
Thank you for passing by.
By Jill Boafo.


Leave a Reply